上次给大家简单的介绍了一下prometheus的核心组件的功能,这次教给大家安装一下prometheus并通过node_exporter采集数据,通过grafana展示node节点信息。
首先我们在官网下载prometheus server、node_exporter安装包,根据操作环境来下来对应的包(官网https://prometheus.io)
1、下载prometheus server
wget https://github.com/prometheus/prometheus/releases/download/v2.35.0/prometheus-2.35.0.linux-amd64.tar.gz
2、解压prometheus包
tar zxf prometheus-2.35.0.linux-amd64.tar.gz
3、做一个软连接
ln -s /usr/local/src/prometheus-2.34.0.linux-amd64/ /apps/prometheus
4、做一个prometheus的service文件
cat /etc/systemd/system/prometheus.service
[Unit]
Description=Prometheus Server
Documentation=https://prometheus.io/docs/introduction/overview/
After=network.target
[Service]
Restart=on-failure
WorkingDirectory=/apps/prometheus/
ExecStart=/apps/prometheus/prometheus --config.file=/apps/prometheus/prometheus.yml
[Install]
WantedBy=multi-user.target
5、启动prometheus服务
systemctl start prometheus.service
然后我们在需要监控的node节点安装node_exporter 监控端口为9100
1、下载node_exporter包
wget https://github.com/prometheus/node_exporter/releases/download/v1.3.1/node_exporter-1.3.1.linux-amd64.tar.gz
2、解压node_exporter包
tar zxf node_exporter-1.3.1.linux-amd64.tar.gz
3、后台运行node_exporter的执行文件
nohup ./node_exporter &
补充:node_exporter service启动文件
cat /etc/systemd/system/node-exporter.service
[Unit] Description=Prometheus Node
Exporter After=network.target
[Service]
ExecStart=/usr/local/node_exporter/node_exporter
[Install] WantedBy=multi-user.target
我们安装完成prometheus server 和node_exporter后我们来讲一下prometheus.yml文件
grep -v "#" prometheus.yml
global:     #全局设置
  scrape_interval: 15s  #设置数据的采集周期,默认一分钟
  evaluation_interval: 15s   #rule的采集周期,默认一分钟
alerting:
  alertmanagers:
    - static_configs:
        - targets:

rule_files:

scrape_configs:    #静态采集配置
  - job_name: "prometheus"    #组名称为prometheus
    static_configs:
      - targets: ["localhost:9090"]

  - job_name: "k8s-node"    #组名称为k8s-node
    static_configs:
      - targets: ["10.0.0.112:9100","10.0.0.113:9100","10.0.0.114:9100"]  #node节点的静态ip地址加node_exporter端口
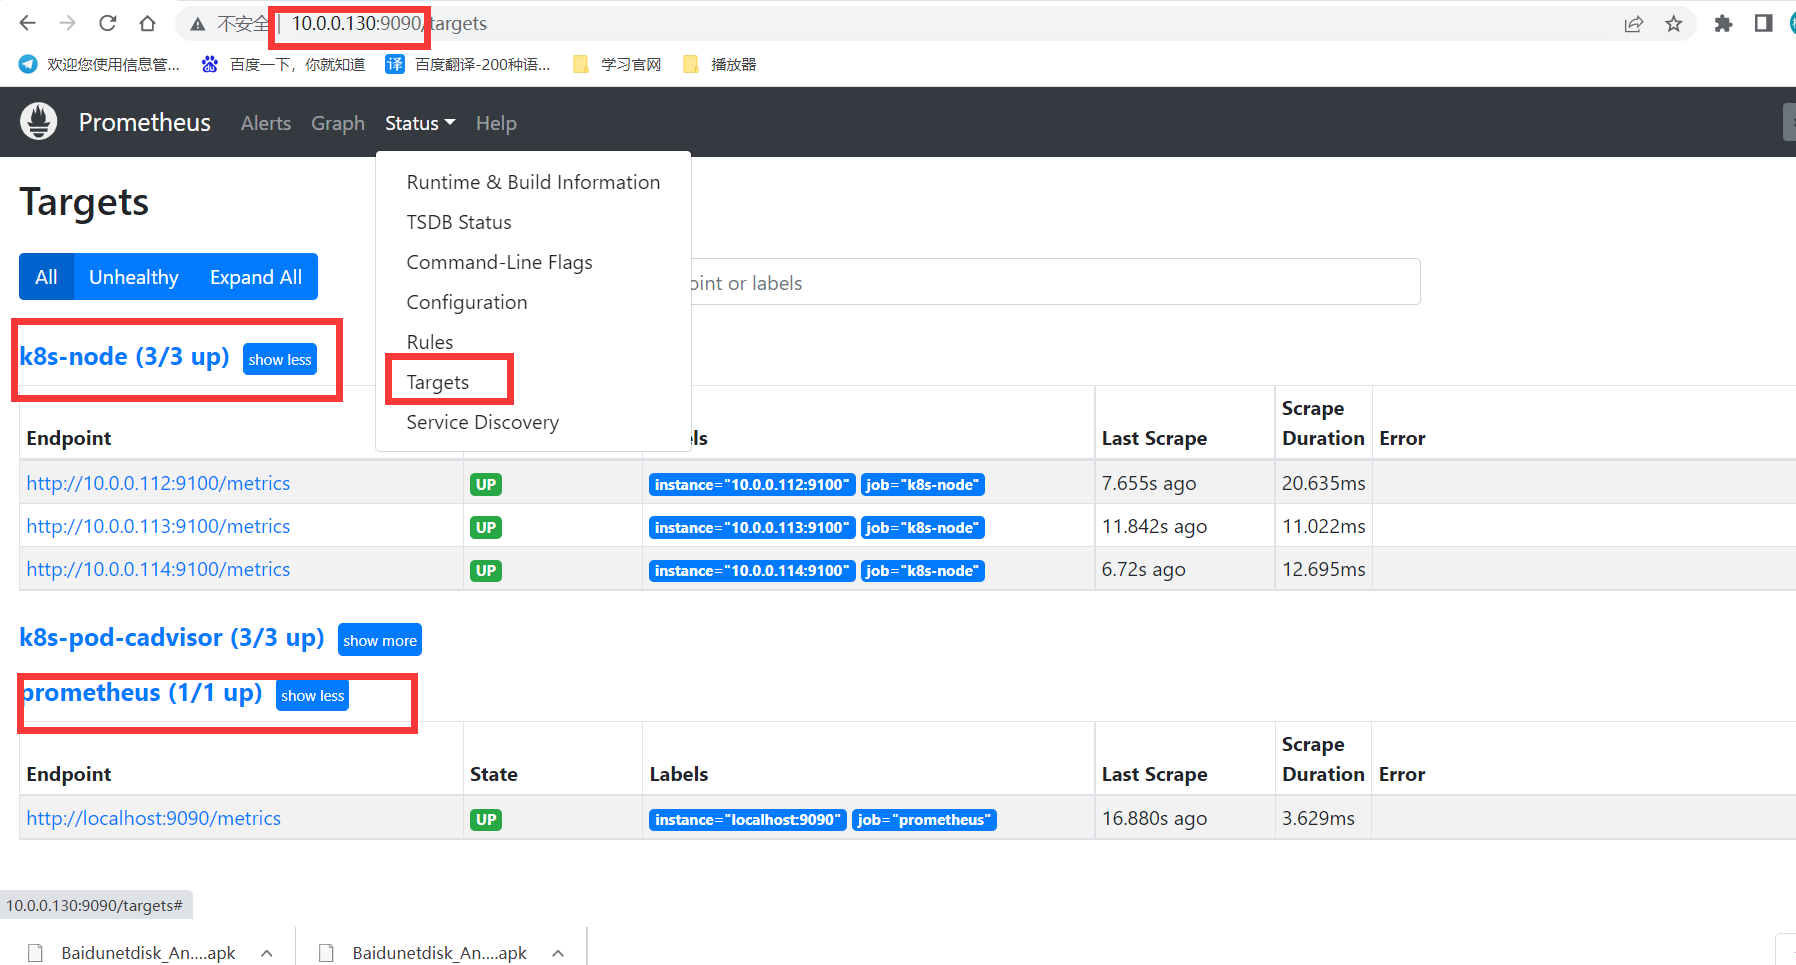
配置完成后重启prometheus server服务,然后我们访问prometheus server地址端口为9090
我们可以查看到所添加的node节点状态为up,这就是已经在采集数据中
下面我们来安装grafana(官网https://grafana.com/)
1、根据官方网站操作来进行安装
sudo apt-get install -y adduser libfontconfig1    #安装依赖
wget https://dl.grafana.com/enterprise/release/grafana-enterprise_8.5.2_amd64.deb   #下载包
sudo dpkg -i grafana-enterprise_8.5.2_amd64.deb   #安装包
2、修改配置文件
vim /etc/grafana/grafana.ini
[server]
# Protocol (http, https, socket)
protocol = http   #协议

# The ip address to bind to, empty will bind to all interfaces
http_addr = 0.0.0.0   #绑定本机地址

# The http port to use
http_port = 3000    #监听端口
3、启动grafana
# systemctl start grafana-server.service
# systemctl enable grafana-server.service
登录界面 默认帐号admin 密码admin

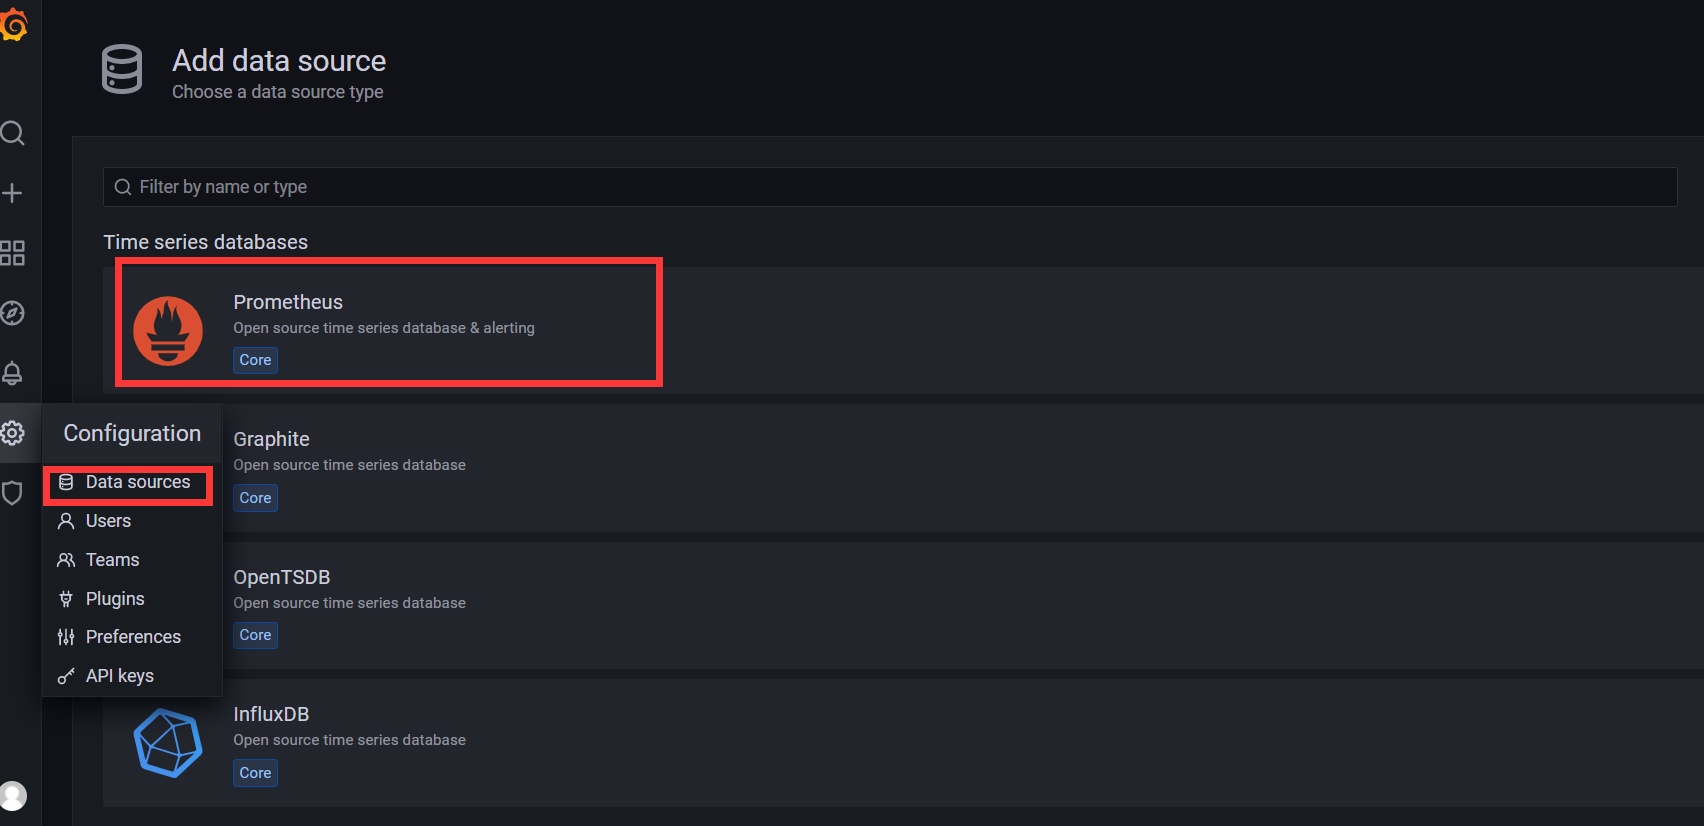
添加prometheus数据源
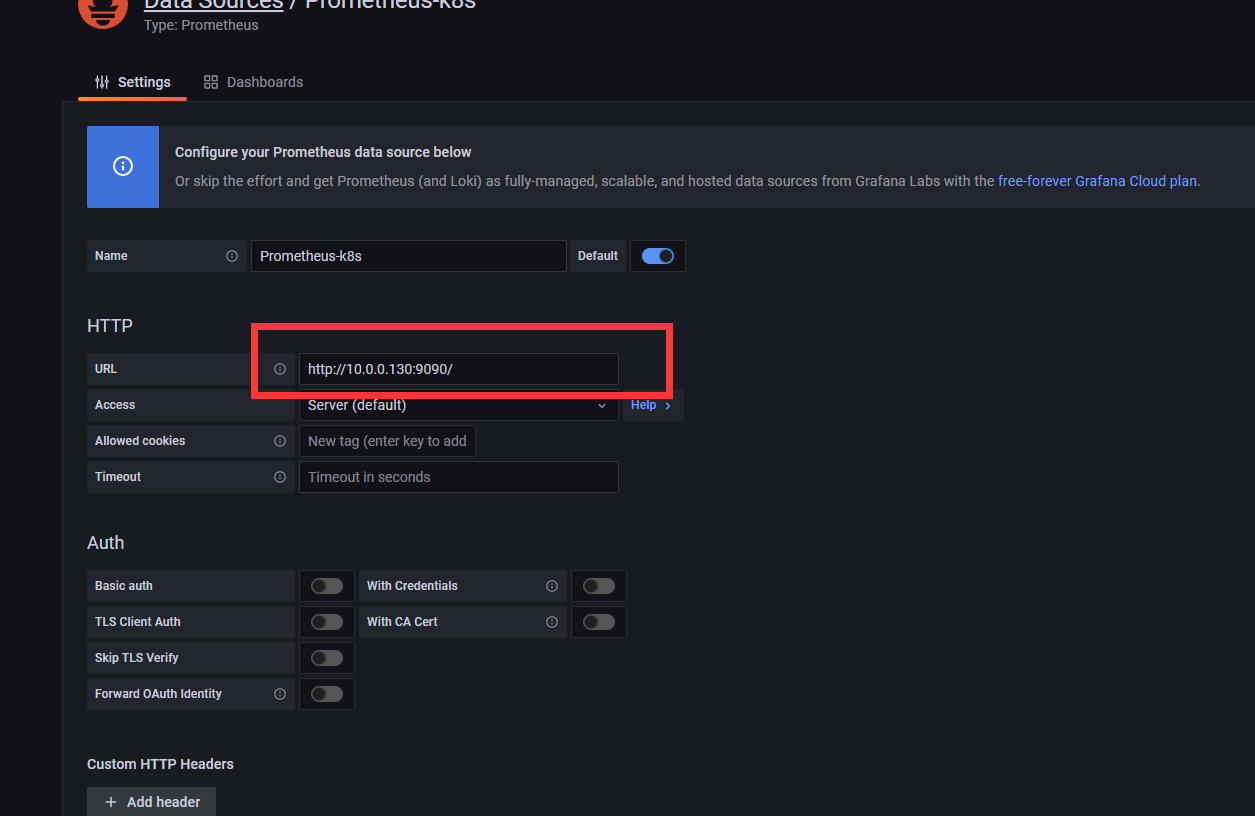
添加prometheus的访问地址即可保存
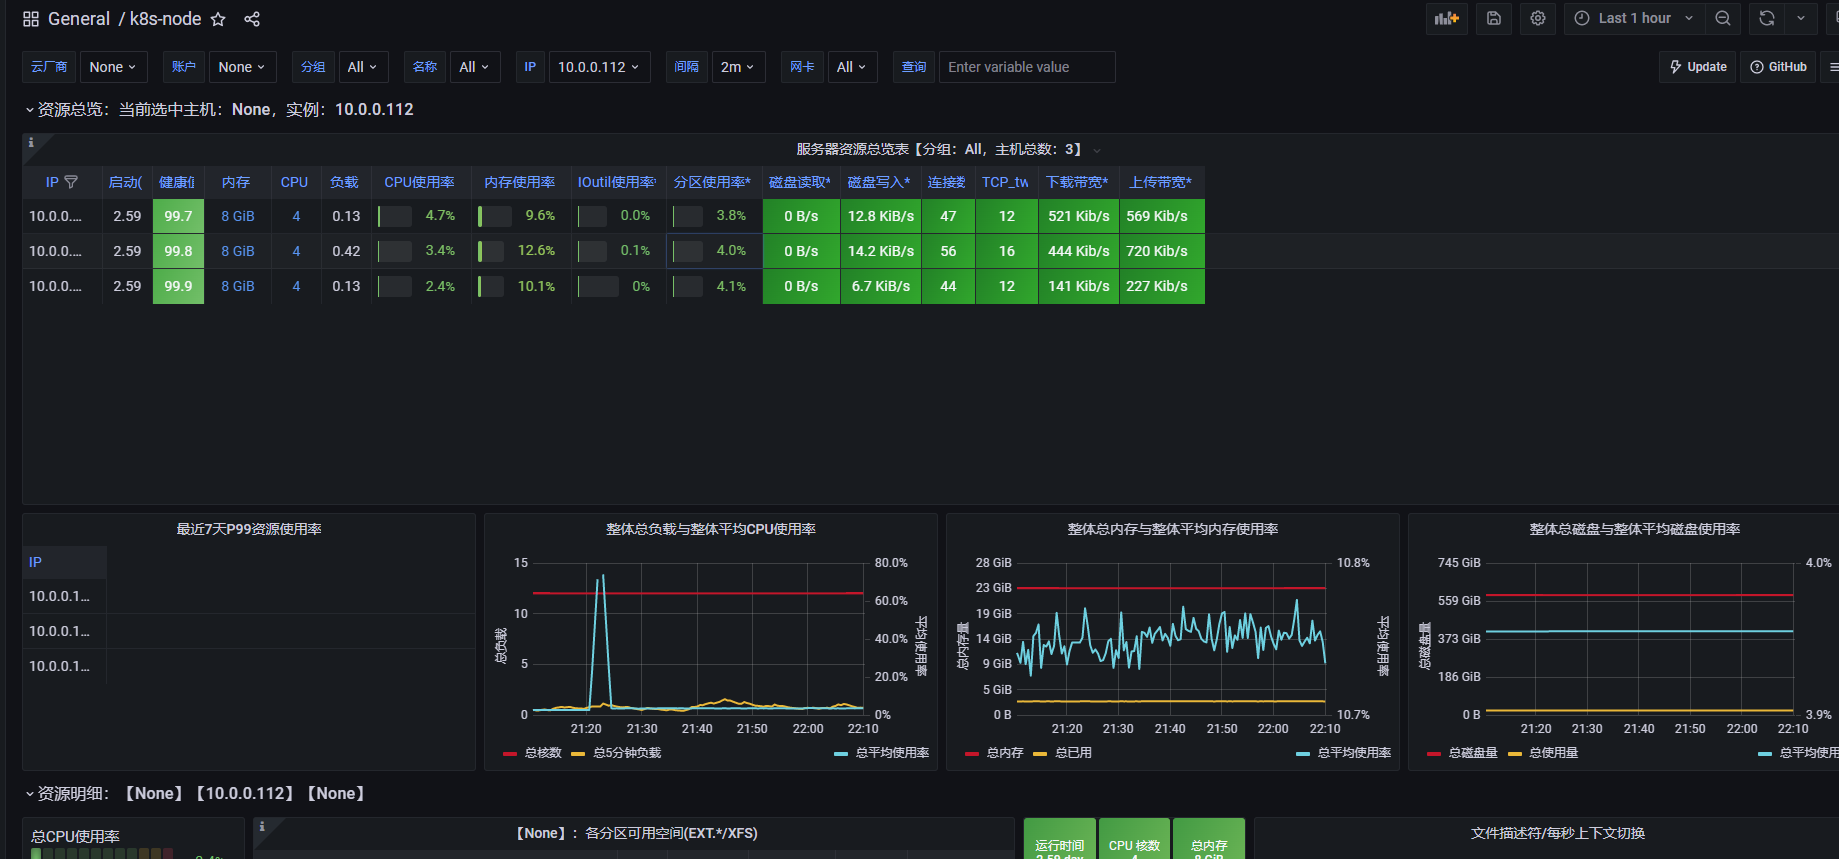
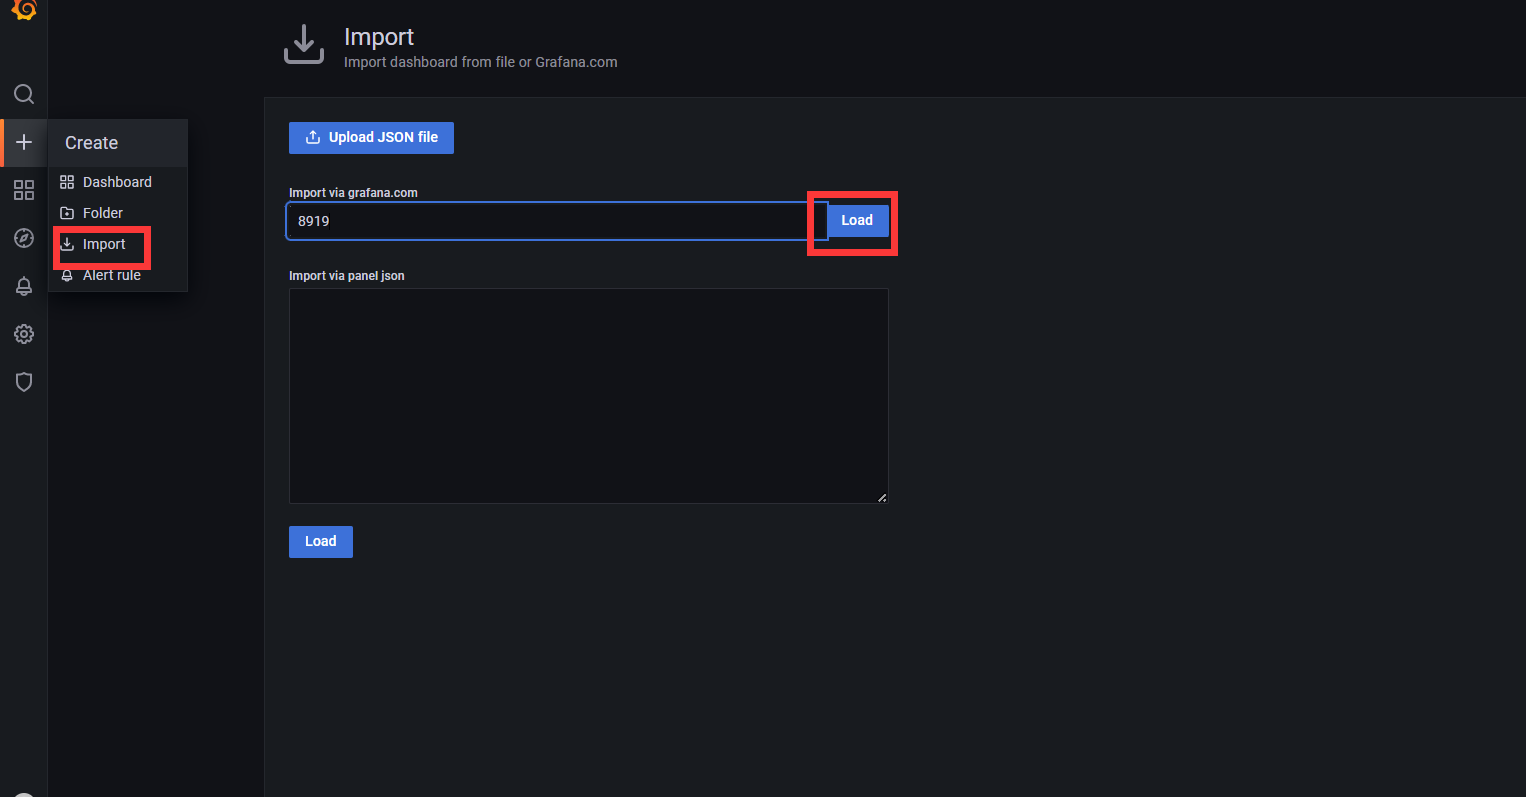
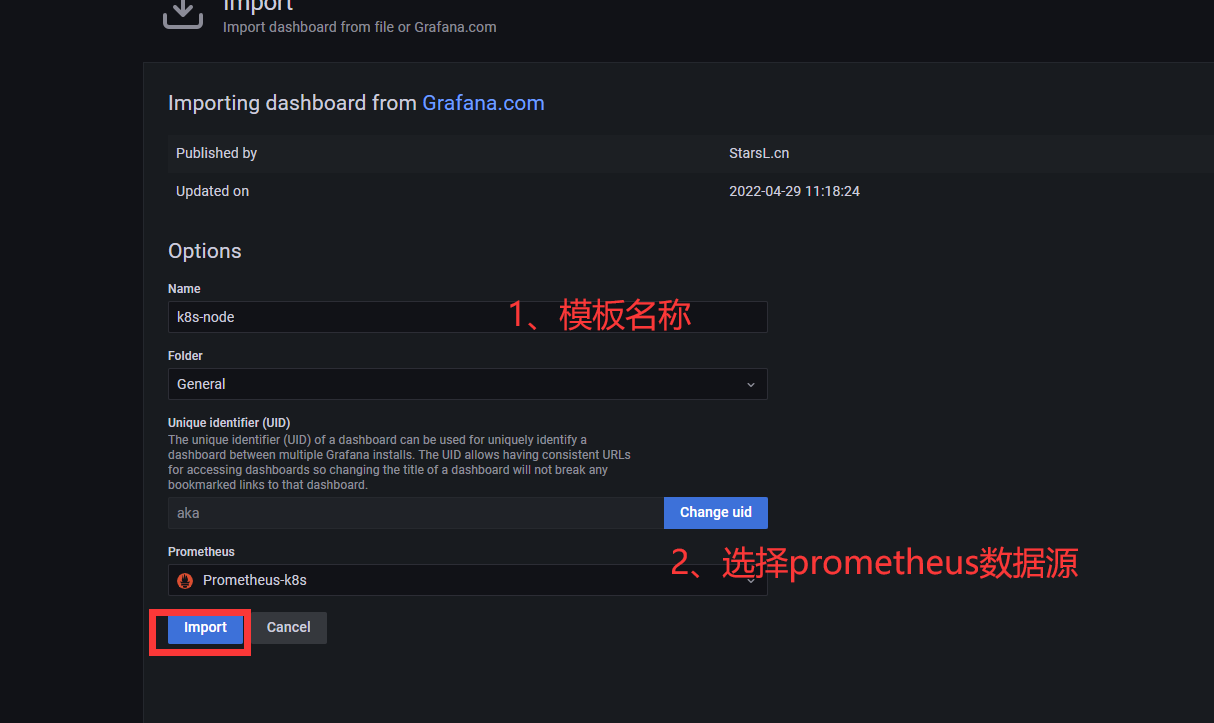
在grafana官网找一下对应node的图形模板,本次使用8191
图形展示完毕